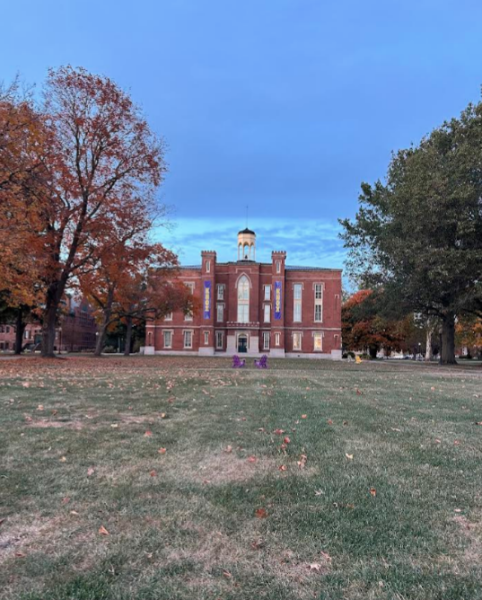
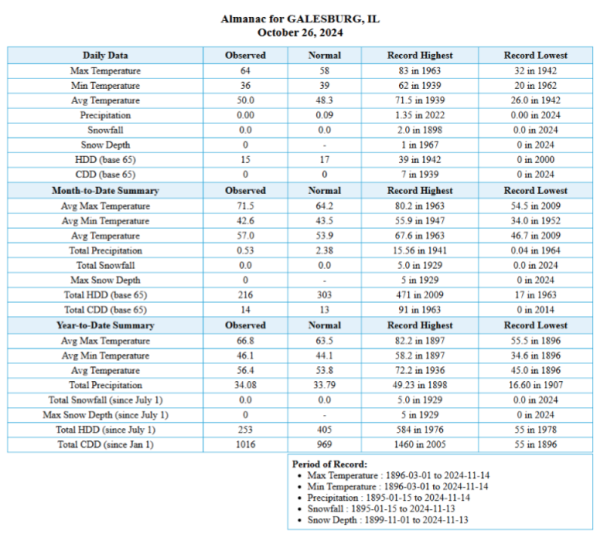
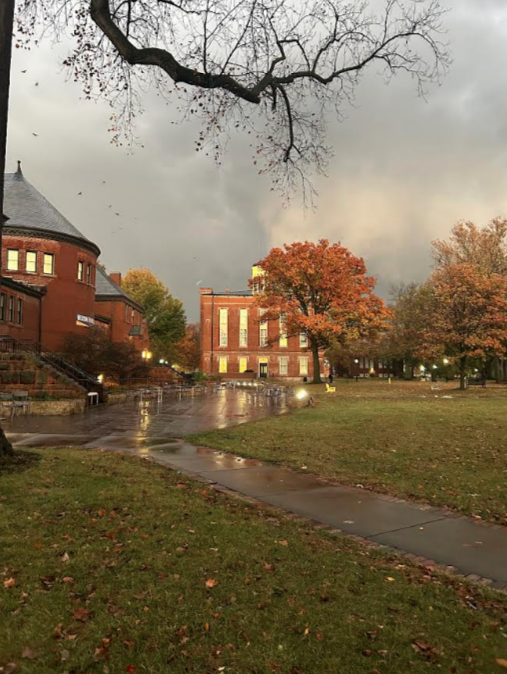
[October 26, 6:02pm. The grass looks dry; some trees have changed color, while some haven’t. According to National Weather Service data, the observed month-to-date precipitation was significantly lower than the normal monthly precipitation for October.]
Some may have noticed that the trees around campus did not change color as brightly as is typical this fall. Some trees also lost their leaves when they were still green.
Biology professor Stuart Allison said that this is caused by drought, because the trees undergo stress.
“They’re stressed by the drought, so they may either, just the leaves turn sort of brownish and then drop, or, when we get, as we did, sort of a sudden cold spell when it had been warm, they may actually drop the leaves when they’re green, but they don’t seem to have the energy to be able to go through the color change,” Allison said.
The strongest pigment in leaves is chlorophyll, which allows the plant to undergo photosynthesis. This process converts sunlight and carbon dioxide into usable energy for the plant. Chlorophyll also gives leaves their green color. But leaves contain other pigments, too: xanthophylls, which are red, and carotenes, which are yellow.
“As the trees get ready to drop their leaves and prepare for winter, one of the things they do is they start breaking down those pigments and sort of sucking them, whatever material they can essentially recycle back into the tree and store it in the roots for the winter,” Allison said. “What they typically break down and remove first is the chlorophyll, so then what remains longer are the xanthophylls and carotenes. But it seems like if they don’t, if they’re stressed, they don’t go through this sort of orderly process that they do when it’s nice and wet.”
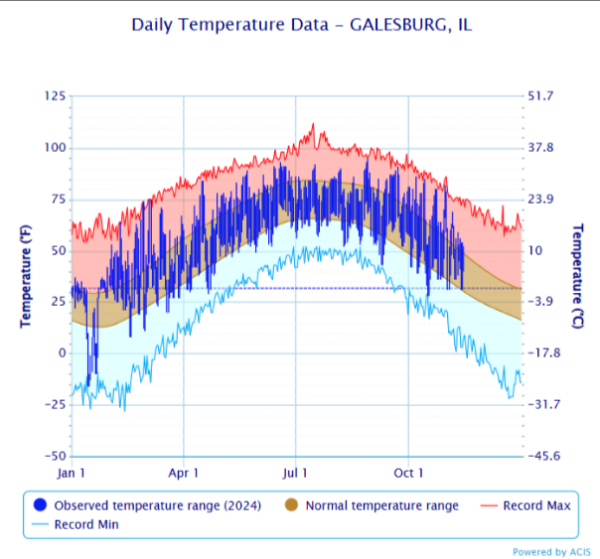
Allison said that this past August, September, and October were unusually dry.
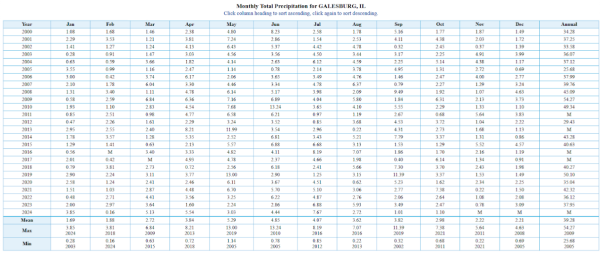
According to data from the National Weather Service, Galesburg has experienced unusual precipitation amounts compared to averages this year. While January, March, April, and July had much higher precipitation than normal, February, May, August, September, and October were exceptionally dry. The table below shows monthly precipitation levels in Galesburg from 2000 to 2024.
Because of these recent dry conditions causing the trees stress, the leaves did not change colors as vibrantly.
Besides drought impacting the appearance of the colors, Allison explained that warmer temperatures cause the leaves to change color later. In Central Illinois, the color change of fall foliage typically starts peaking in mid October.
Trees begin breaking down their chlorophyll when they receive less sunlight, both because of shorter daylight hours and cooler temperatures.
“You’re always going to get the day length changing at the same time, but then also changes in temperature, so you’re not getting those cool nights earlier in the fall, so they really notice when temperatures start to get close to freezing,” Allison said. “When you don’t get that, then it delays that response, pushes leaf color change back further, later in the year.”
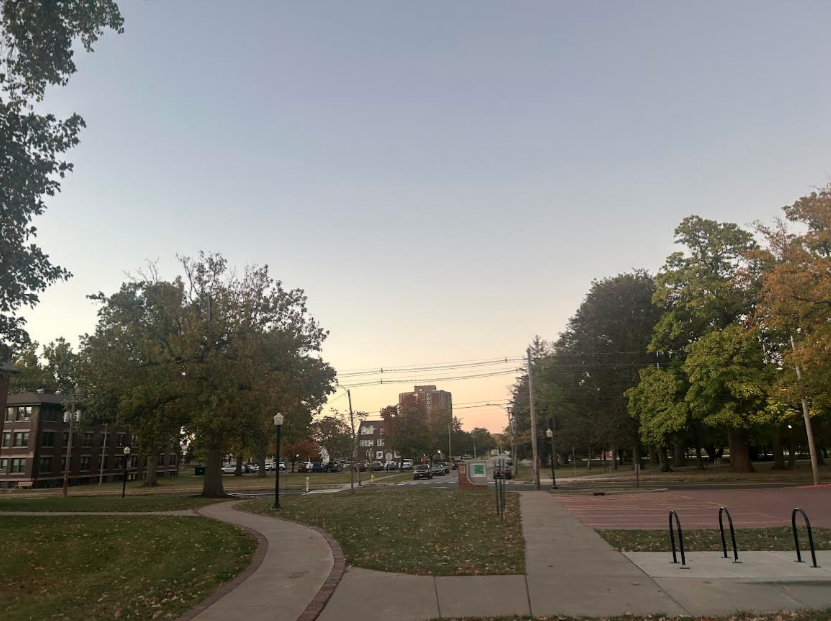
[October 17, 6:24pm. Many trees still look quite green, despite this time being when fall foliage normally peaks. According to National Weather Service Data, on this day, the observed month-to-date average minimum temperature was slightly below what is normal, but combined with a higher average maximum temperature for the month, the month-to-date average temperature is slightly higher than normal.]
“It’s warmer on average than it used to be. The warm extends further into the fall than it used to. The other thing, we also are getting increased really heavy rainfall events like we just got [recently] when it just dumped,” Allison said. “And those things all fit the climate change models, right? It also tends to warm up quicker in the spring, so our winters are getting shorter.”
[Nov. 5, 5:08pm. According to National Weather Service data, Galesburg experienced unusually high rainfall on this day. The observed temperatures throughout the day were also much higher than normal.]
Climate change has other effects on plants, too. Allison said a few years ago, he and a student researched wildflower bloom times at Green Oaks, Knox’s biological field station about 20 miles from campus, and found that wildflowers are blooming earlier in the spring.
“They’re responding a lot to soil temperature, so as the springs get warmer, they’re warming up faster, so it gets warmer faster. It stimulates growth by the plants. They start blooming earlier,” Allison said.
He said other researchers have published findings that this is happening in other regions, too. These effects disrupt patterns, not only on a species level but also in the relationships species have with each other.
“One of the things we worry about, then, is that plants are responding a lot to temperatures here, whereas, say, migratory birds are really responding primarily to things like changes in day length. So they’ve migrated somewhere south, they’re keeping track of day length, and when the days start to change, they plan their migrations back,” Allison said. “Well, again, since day length doesn’t really vary, but temperature has, the migratory events get out of sequence with things that might serve as their food. Some of these patterns that have long been established are starting to get out of sequence with each other.”
Impacts of climate change on people
Changes in temperature have serious implications for humans, and these effects are already being felt. They are projected to worsen over time unless significant reductions in greenhouse gas emissions can prevent the most extreme warming.
Daily temperature minimums and maximums are becoming more extreme, but average temperatures are increasing.
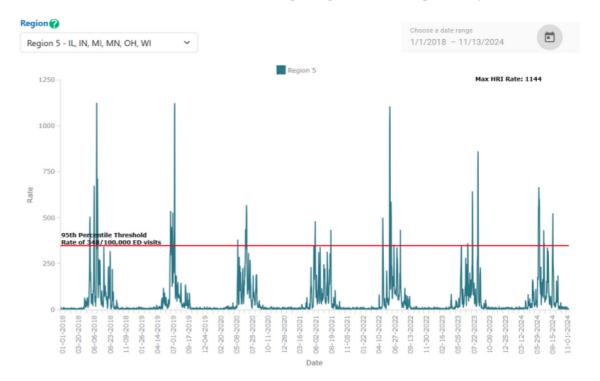
The chart below, from the CDC’s Heat and Health Tracker, shows heat-related hospitalizations since 2018 in the states of Illinois, Indiana, Michigan, Minnesota, Ohio, and Wisconsin. Every summer, hospitalizations increase dramatically, as nearly all heat-related illnesses occur in the hottest months. However, these increases are beginning earlier than in previous years.
According to Assistant Dean for Campus Life Jake McLean, not every residential space on campus has central air conditioning, so window A/C units were put into these spaces beginning in 2021.
“There is only central A/C in Hamblin, 265 S. Academy, the Beta Theta Pi House, 284 W. Tompkins, 270 W. Tompkins, the townhouses, Harambee, Eco, and Q&A House. Exec has A/C units in the living room of the apartments. All others require window units or common room A/C,” McLean said in an email.
The Campus Life Office works with Facilities to install A/C units in the common rooms of the spaces that do not have central A/C.
Environmental Injustice in Galesburg
Not everyone experiences the effects of climate change equally.
Communities of color, particularly Black communities, are disproportionately harmed by climate change, pollution, and toxic waste. Because of a history of racist housing policies, neighborhoods today remain heavily segregated by race and income.
Toxic industrial facilities concentrate in communities of color, where institutional racism causes lower fines to be issued to corporations than if they were polluting in an affluent white neighborhood. Also, when polluters move into an area, the surrounding property values decrease, keeping many Black residents from being able to sell their homes and move. Living and working near toxins increases people’s risk of health problems, like cancer.
As temperatures rise, people of color are more likely to face health complications. Also, as extreme weather events happen more frequently, the government responds less urgently to environmental harms in communities of color than in white communities.
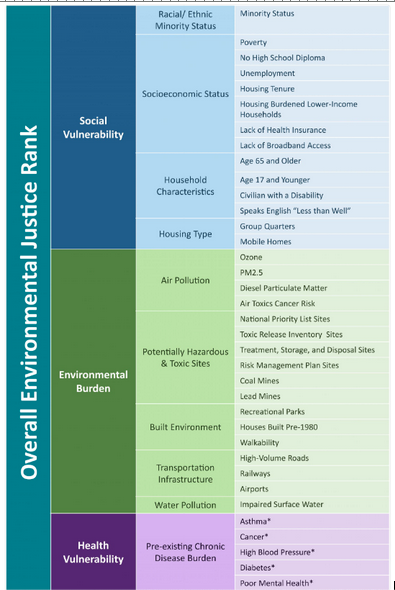
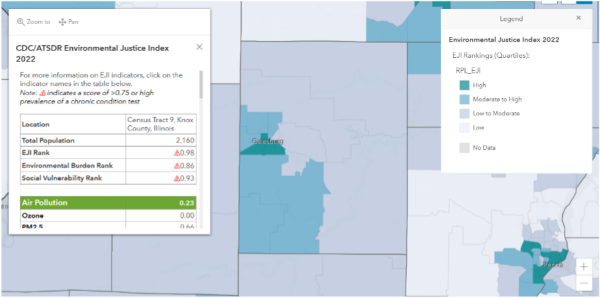
The CDC’s Environmental Justice Index (EJI) Explorer displays information about indicators of environmental injustice in census tracts within each county in the forty-eight contiguous states. The EJI rank is a measure of the environmental burden the census tract faces as a combination of various social, economic, environmental, industrial, and health factors, as shown below. The EJI rank is shown as a percentile that corresponds to the percentage of other census tracts that have lower levels of environmental burden. For example, a rank of 0.45 means that 45% of other census tracts in the country have equal to or less severe overall environmental burdens than that one, and 55% of other census tracts have more severe environmental burdens.